Data Analytics Learn the basic theory of statistics and implement it in Python (Part 3, Null and Alternative Hypotheses (3) - Hypothesis Testing Python Code)
23-03-21
본문
In the previous article we learned about the null hypothesis testing procedure.
Link: http://tokenterrace.com/eng/212
Let's implement it in Python code so that you can put the theory into practice.
First of all, I will create a fictitious dataset for the sake of simplicity, as I don't have any data, and you can use the dataset for your work or assignments.
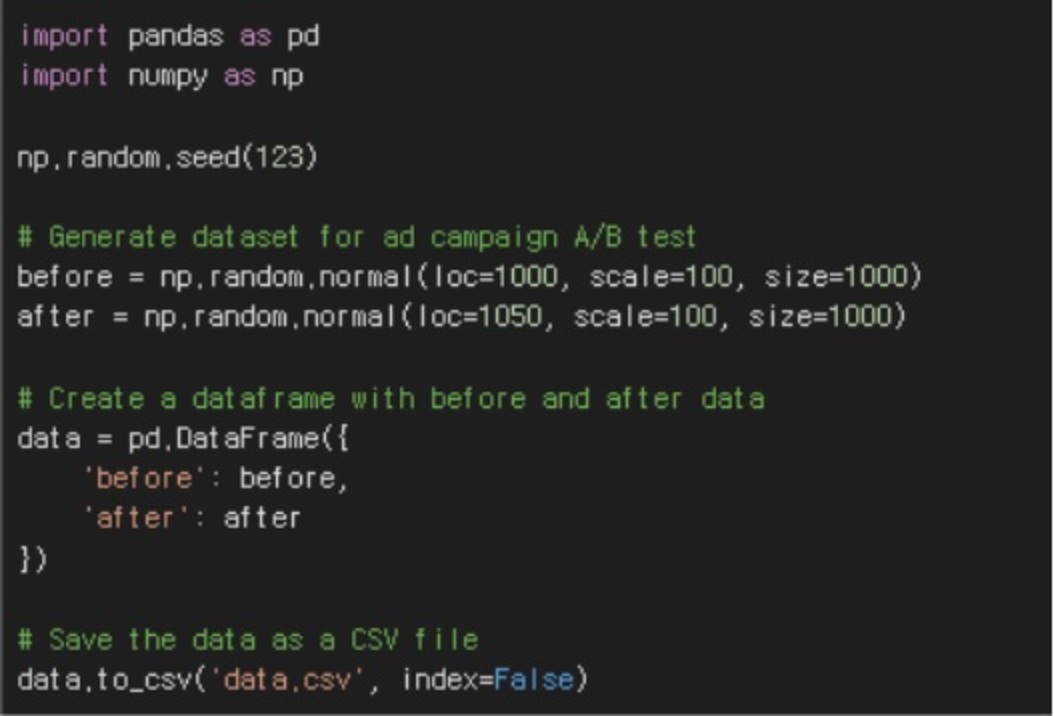
Let's explain the code in more detail.
- np.random.seed(123) : fixes the seed of the random number generator. Using the same seed will always give you the same result.
- before = np.random.normal(loc=1000, scale=100, size=1000) : Generate sales data before the ad campaign runs. Draw 1000 samples from a normal distribution with a mean (loc) of 1000 and a standard deviation (scale) of 100.
- after = np.random.normal(loc=1050, scale=100, size=1000) : Generate sales data after the ad campaign. Draw 1000 samples from a normal distribution with a mean (loc) of 1050 and a standard deviation (scale) of 100.
- data = pd.DataFrame({'before': before, 'after': after}) : Combine the sales data before and after the ad campaign into one data frame. pd.DataFrame() is used to create the data frame, and {'before': before, 'after': after} serves to name the columns in the data frame.
- data.to_csv('data.csv', index=False) : Save the created data as a CSV file. data.to_csv() is used to save it as a CSV file, and index=False is an option to not save an index. Typically, an index contains information about the order of the data. For example, if the first row in a dataframe is index 0, then index 1 means the second row. However, in a dataset, indexes often don't hold any information about the data, so you can remove unnecessary data by not saving indexes. Also, not saving indexes prevents indexes from being created automatically when you import a CSV file. This can result in new indexes being assigned to the imported data, so it is recommended that you use the index=False option if you do not use indexes in your dataset.
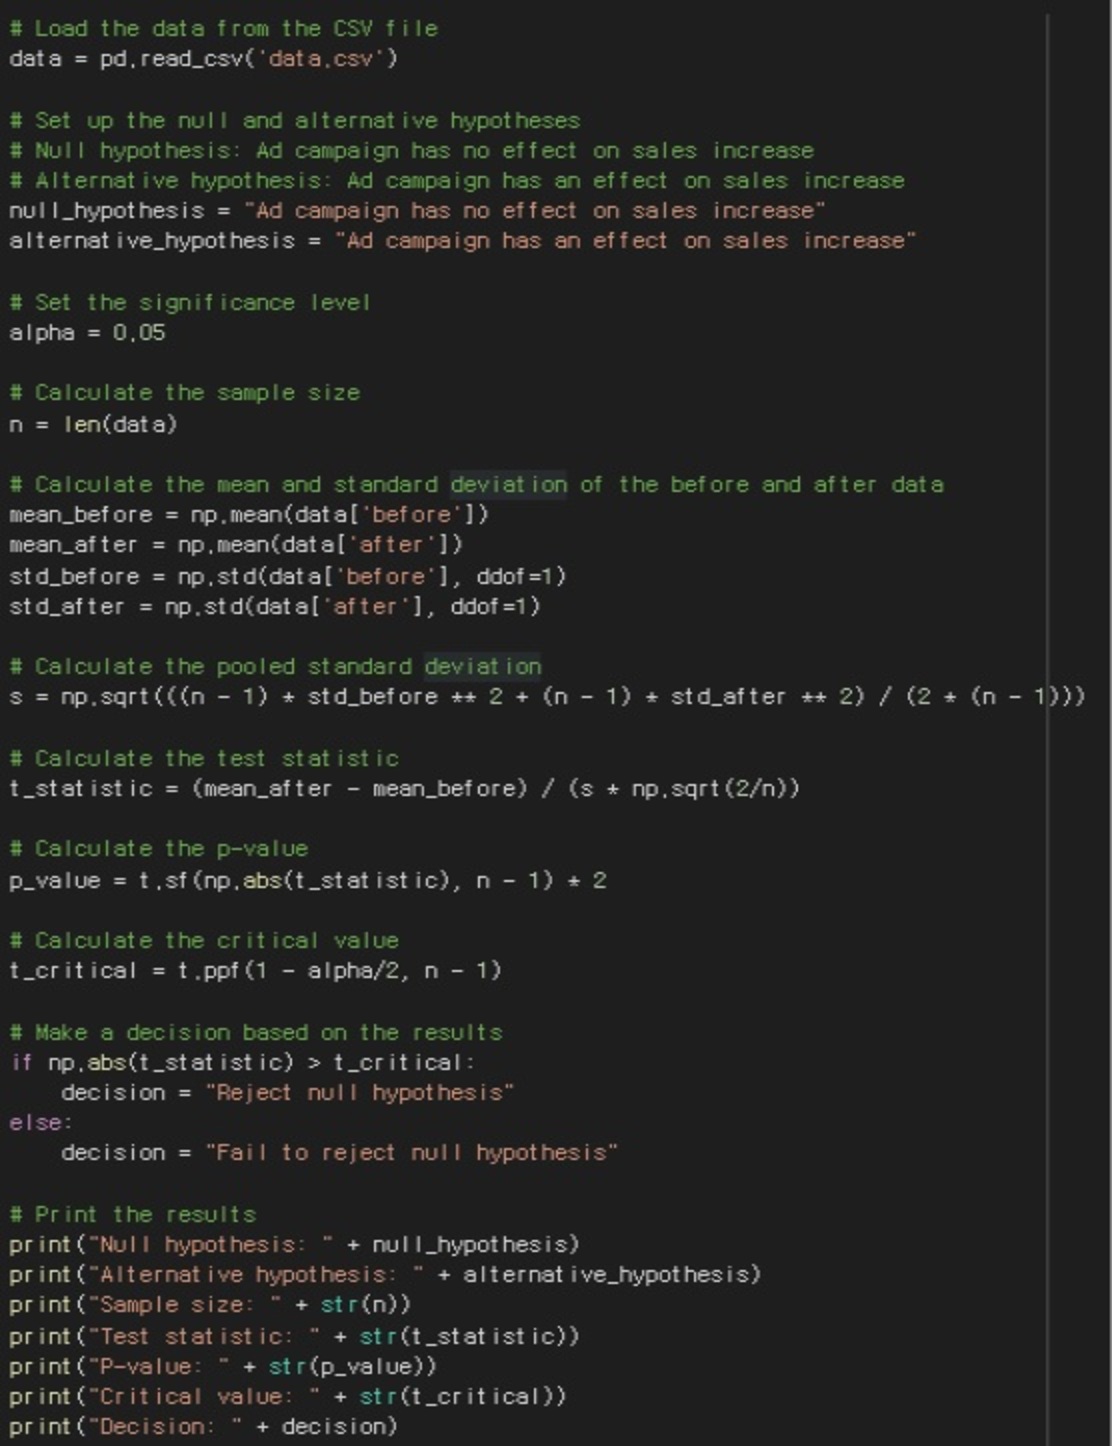
Let's explain the code in more detail.
- data = pd.read_csv('data.csv') : Load data from CSV file. pd.read_csv() is used to load the CSV file, and it reads the sales data before and after the ad campaign from the data.csv file and converts it into a dataframe.
- null_hypothesis and alternative_hypothesis : Set the null and alternative hypotheses.
- alpha = 0.05 : Set the significance level. Normally, the significance level is set to 0.05.
- n = len(data) : Calculate the sample size. Use the len() function to get the number of rows in the dataframe.
- mean_before, mean_after, std_before, std_after : Calculates the mean and standard deviation before and after the ad campaign. Use the np.mean() function to get the mean, and the np.std() function to get the standard deviation.
- S: Calculates the pooled standard deviation. The pooled standard deviation is calculated by combining the variance estimates before and after the ad campaign.
- t_statistic: Calculates the test statistic. The t-statistic is the difference between the mean before and after the ad campaign divided by the pooled standard deviation and sample size.
- p_value: Calculates the probability of significance. The probability of significance is the probability that the t-distribution has a value similar to or more extreme than the test statistic.
- t_critical: Calculates the critical value. The critical value is calculated from the t-distribution based on the significance level and degrees of freedom.
- decision : Outputs the test result. If the test statistic is greater than the critical value, the null hypothesis is rejected; otherwise, the null hypothesis is accepted.
In the code above, we import the sales data before and after the ad campaign from the data.csv file, calculate the mean and standard deviation of the two groups to get the test statistic, and calculate the two-sided test probability corresponding to the test statistic. It then uses the distribution table of the t-distribution to calculate the test rejection interval and prints the test results.
# output result
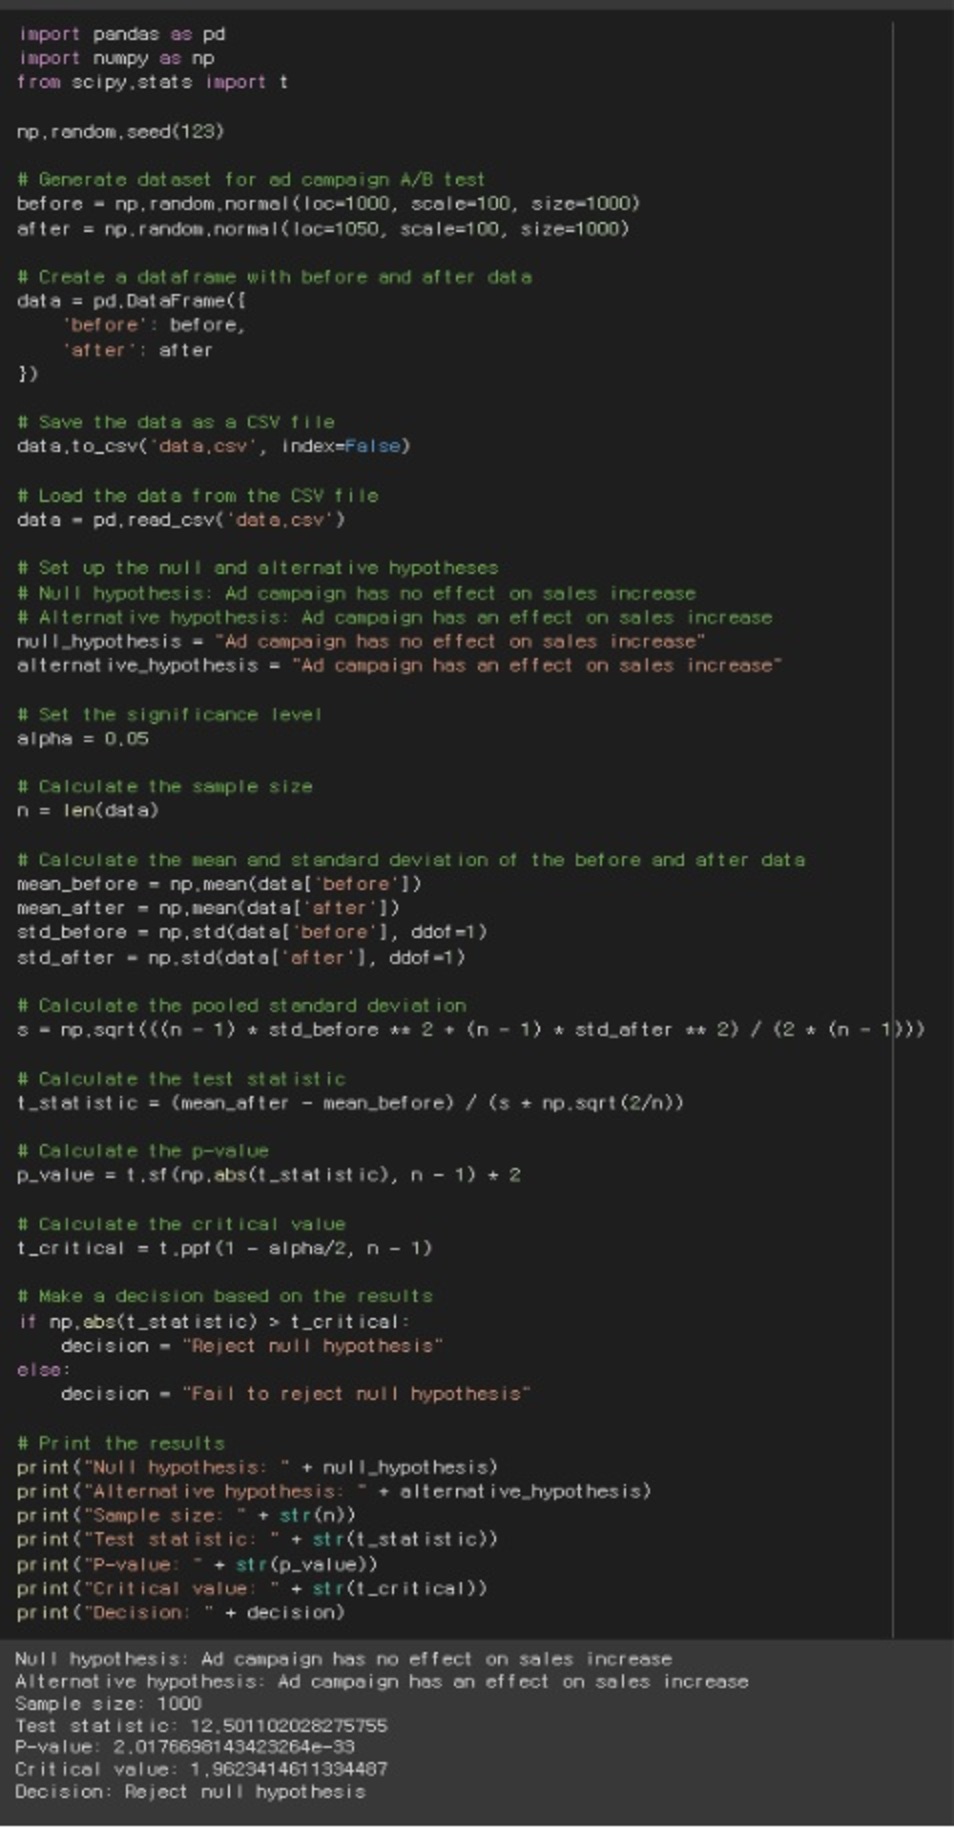
Interpreting the results of the hypothesis test is as follows
- Null hypothesis: Ad campaigns have no effect on revenue growth.
- Null hypothesis: Ad campaigns have an impact on revenue growth.
- Test statistic: 12.501102028275755
- P-value: 2.0176698143423264e-33
- Significance level: 0.05
- Critical value: 1.9623414611334487
- Conclusion (Decision): Reject the null hypothesis
The above results indicate that we should reject the null hypothesis and accept the alternative hypothesis because the probability of significance is very small (P-value < 0.05), which means that the ad campaign had an impact on the increase in sales. Since the test statistic is greater than the rejection interval, we reject the null hypothesis.

