Data Analytics Learn the basic theory of statistics and implement it in Python (Part 2, Independent and Dependent Variables)
23-03-03
본문
You've probably heard of independent and dependent variables in statistics, but do you know what they are and how they relate to each other?
An independent variable is a variable that a researcher can control or manipulate to observe its effect on a dependent variable.
The dependent variable is the variable that is affected by the independent variable, the one you want to know how it changes, and the one you want to study or measure.
For example, let's say you want to study the relationship between rainfall and plant growth. Rainfall is the independent variable because it is being manipulated by nature. Plant growth is affected by rainfall, so it's the dependent variable.
The important thing about analyzing data is to be able to derive meaningful information from it and use it to make decisions.
This meaningful information we call insights.
To get insights, you need to be able to understand the meaning of the independent and dependent variables, not just understand the data.
Independent variable = the variable that causes something to happen.
Dependent variable = the variable that is the result of the independent variable
This can be a little confusing, so let me give you an example.
If
"Rainfall determines the height of a plant's growth"
then the cause is rainfall and the effect is the height of the plant's growth.
Note that just because the cause affects the effect doesn't mean the effect affects the cause.
Rainfall doesn't change the height of a plant's growth, does it?
So the cause is independent and is called the "independent variable", and the effect is dependent on the cause and is called the "dependent variable".
Now that you understand independent and dependent variables, let's look at correlation.
If a change in one variable causes a change in another variable, we can assume that the two are related, which is called a "correlation".
There are a few caveats to analyzing correlation
1. correlation is not causation.
-> Just because two variables are correlated doesn't mean that one causes the other.
There may be other factors involved, and testing for causation requires more stringent assumptions and experimental design.
2. Outliers: Extreme values in the data can skew the correlation coefficient and lead to incorrect conclusions.
3. Sample size: Sample size can affect the accuracy of the correlation coefficient. In general, the larger the sample size, the more confidence you can have in the correlation.
4. Non-linear relationships: Correlation coefficients only measure linear relationships. There may be non-linear relationships between variables that are not predicted by correlation analysis.
5. Confounding variables: Another variable may affect the correlation between the variables you want to experiment with.
It's important to control for these variables to evaluate the relationship between the variables of interest.
6. Validity: Even if two variables appear to be correlated, they may not be. You need to examine the context and potential confounders to measure validity.
Once you have an understanding of your independent and dependent variables and their correlations, let's talk about standard deviation and variance.
Standard deviation and variance are two important concepts in statistics that measure the spread or variability of a data set.
Both standard deviation and variance are important measures for evaluating the quality of a data set and identifying outliers or unusual patterns in your data.
Higher values of both variables mean that the data is more spread out from the mean, while lower values of both variables mean that the data is more clustered around the mean.
The standard deviation is also the square root of the variance, and is a more commonly used measure of variability because it is in the same units as the original data, unlike the variance, which is in squares.
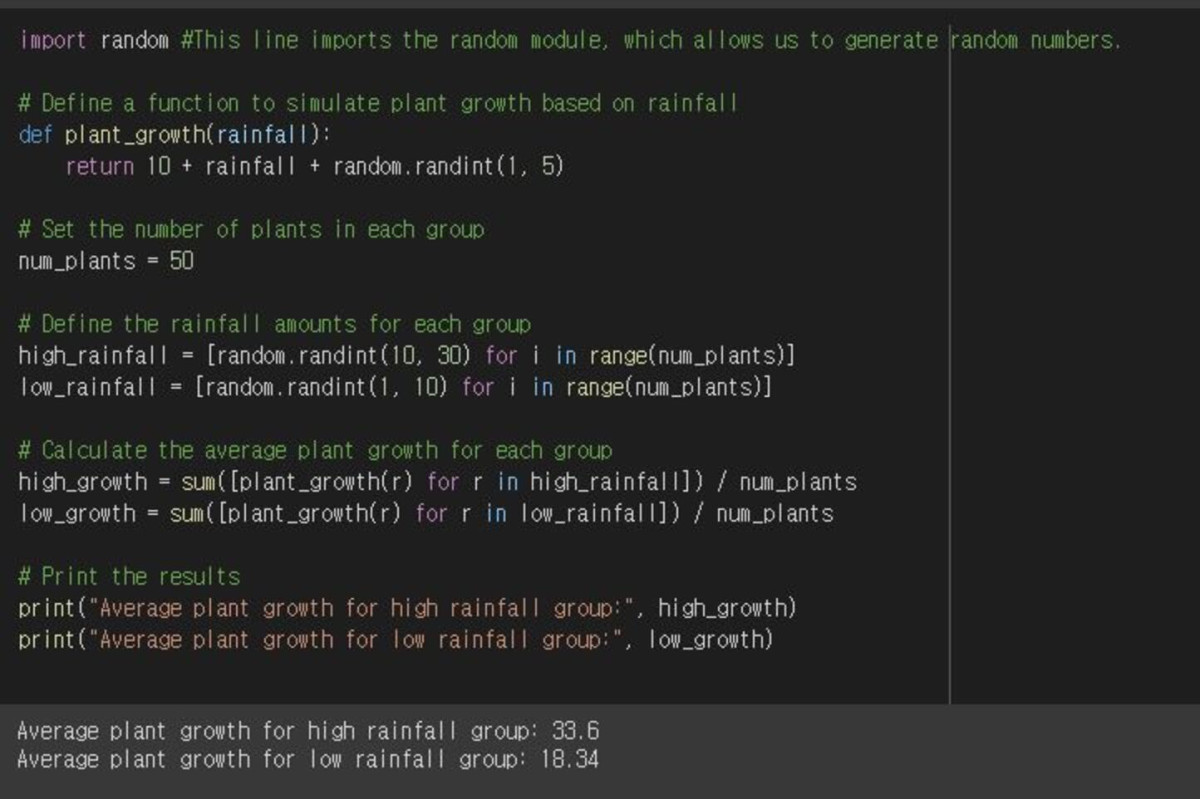
As a simple example, let's simulate the above hypothesis "Rainfall determines the height of plant growth" in Python.
We can simulate plant growth based on rainfall, create two groups of plants exposed to areas with high and low rainfall, and calculate the average plant growth for each group.
The code is organized in a way that makes it easy to understand that the amount of rainfall determines the height of plant growth.
# Code Commentary
I defined two lists, high_rainfall and low_rainfall, containing random integer values representing rainfall.
I'm sure the syntax [random.randint(10, 30) for i in range(num_plants)] was difficult for the uninitiated.
The for loop is an iterative statement, which means that we repeatedly add a random integer between 10 and 30 to the list with the random.randint function.
In for i in range(num_plants), range(num_plants) generates a sequence of numbers from 0 to (num_plants - 1), generating a random integer between 10 and 30 on each iteration.
The resulting integers are collected into a list and assigned to the variables we defined.
To summarize, the code is using a for loop to generate a list of random integers between 10 and 30, with the length of the list determined by the "num_plants" variable.
The plant_growth function calculates the growth of the plants based on the rainfall, I defined a baseline of 10 as the minimum growth height of the plants to simulate natural variation, the number of plants in each group is set to 50, and the rainfall in each group is randomly generated using the random module.
A list of 50 random integers between 10 and 30 is generated for the high rainfall group, and a list of 50 random integers between 1 and 10 is generated for the low rainfall group.
Calculate the average plant growth for each group by applying the plant_growth function to each rainfall value and taking the average.
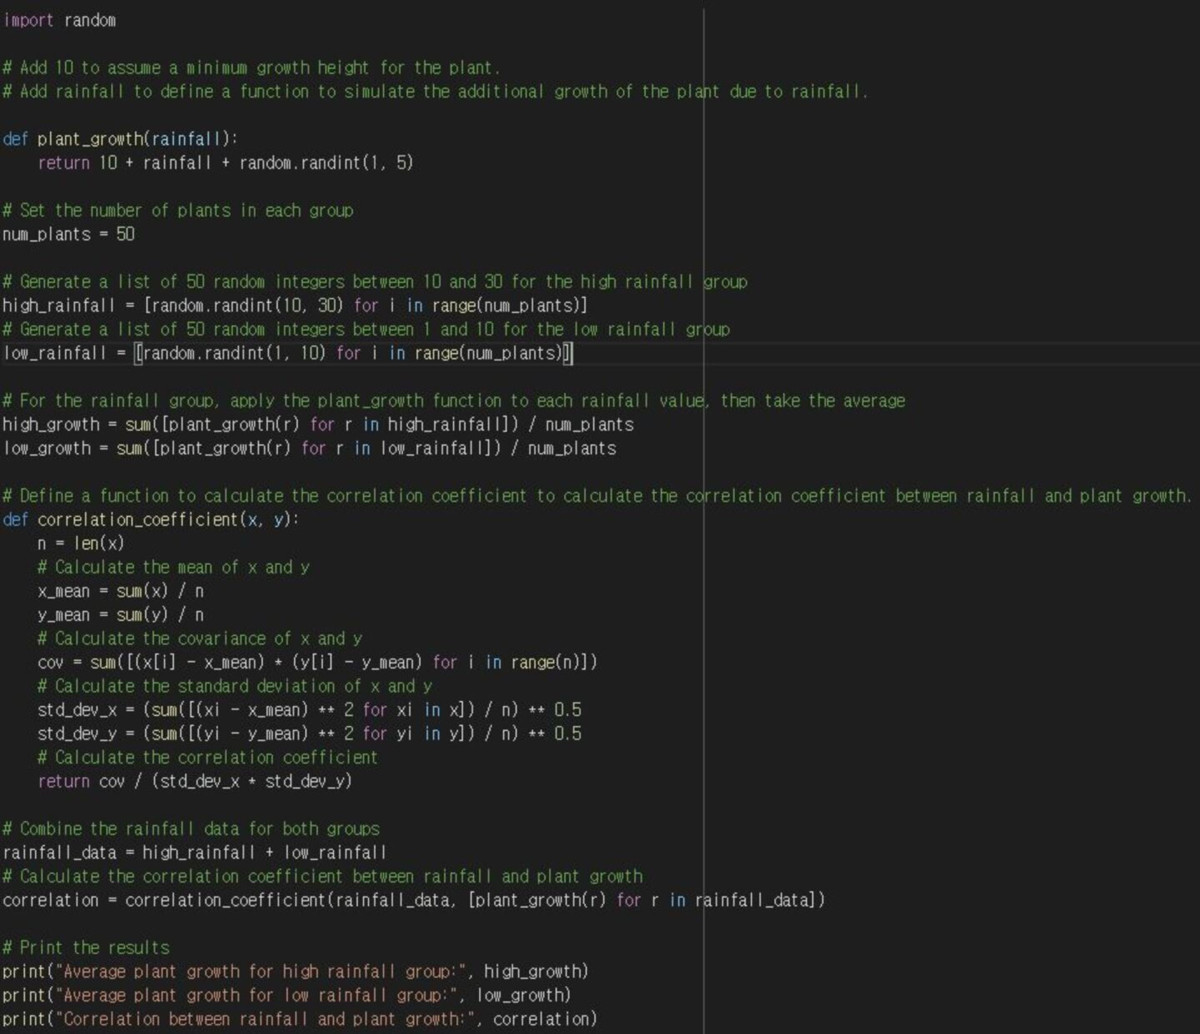
So, let's start correlating.
While we're at it, let's expand the code a bit more.
Those of you who can understand the code in one sitting may find the comments a bit messy, but please bear with me as I'm trying to be as detailed as possible for those who don't have a background in statistics and Python.
The correlation_coefficient() function is defined to calculate the correlation coefficient between two lists of data. The function calculates the mean, covariance, and standard deviation of the data and uses those values to calculate the correlation coefficient.
Finally, the two groups of rainfall data are combined into one list, and the correlation_coefficient() function is applied to the combined rainfall data and the corresponding plant growth height data. The resulting correlation coefficient is output along with the average plant growth height for each group.
This code aims to provide insight into plant growth by calculating the correlation coefficient to identify if an independent variable has a strong correlation with the dependent variable (plant growth).
To summarize, understanding the difference between dependent and independent variables is essential in statistical analysis. However, it is important to recognize that correlation does not imply causation and that further research is needed to establish causation.
# Advanced example
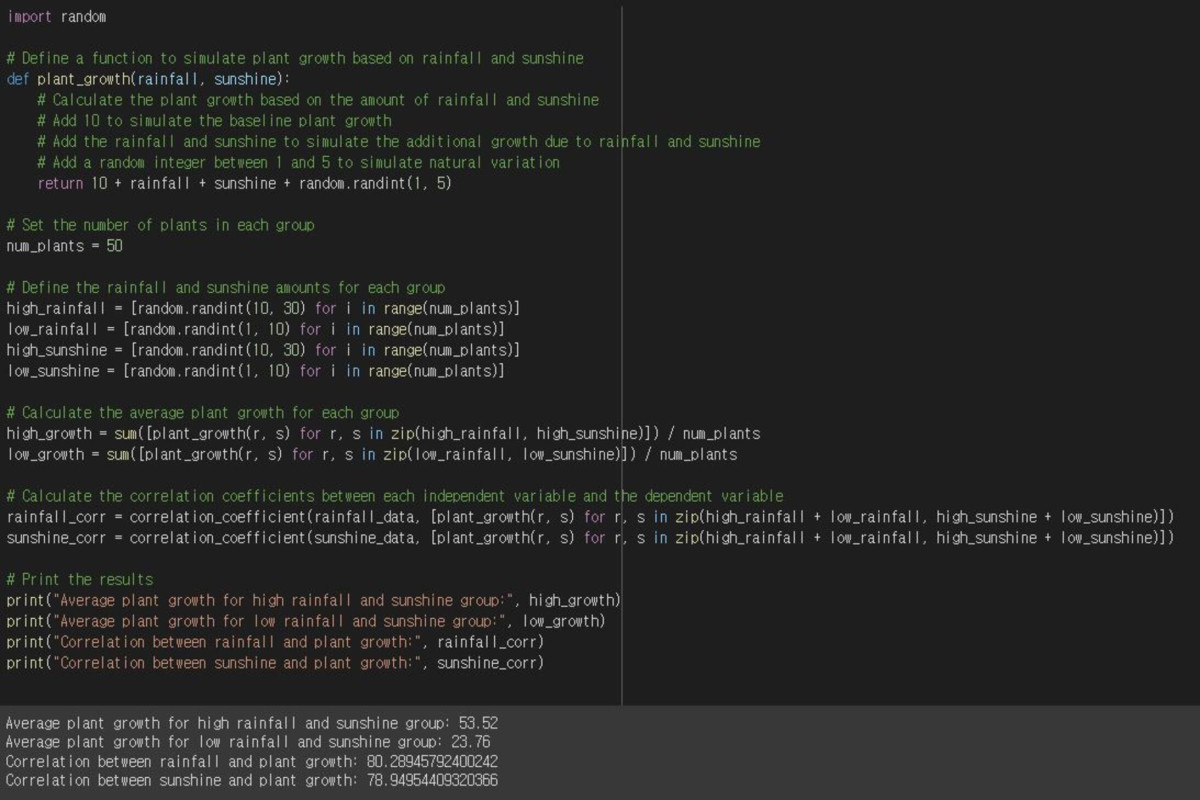
In addition to rainfall, we also added sunshine.
In this way, the independent variables can be expanded, and correlation coefficients should be considered to ensure that they are truly correlated.
The strength of the correlation is between -1 and 1, where 0 is no correlation, closer to 1 is a positive correlation, and closer to -1 is a negative correlation.
Here are some general guidelines for judging correlation numbers
0.0 to 0.2: Correlation is very weak (or negligible)
0.2 to 0.4: Weak correlation
0.4 to 0.6: Moderate correlation
0.6 to 0.8: Strong correlation
0.8 to 1.0: very strong correlation
In fact, you can use the correlation coefficient this way as well, but it's less accurate.
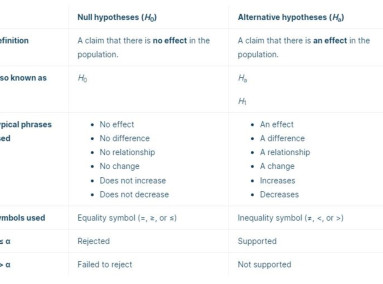
You also need to know about the null and alternative hypotheses for hypothesis testing for correlation coefficients, understand parametric and non-parametric methods, and more.
We will continue to cover these topics in future posts.

