Data Analytics Learn the basic theory of statistics and implement it in Python (Part 1, Random Variables)
23-03-03
본문
In truth, statistics has lost some of its significance as programming languages, machine learning, and deep learning have advanced. Of course, data scientists and analysts who examine data to comprehend it or create models may not fall under this category.
However, if you're an IT auditor, performance marketer, business analyst, growth hacker, etc. who uses data analytics to make quick decisions or quantify the basis for decisions, I don't think you need to understand all the components of statistics.
Without a doubt, the more knowledge you have, the better off you'll be. Nevertheless, each job has a unique set of skills that must be mastered, and there is only so much time in which to do so.
Statistical theory is undoubtedly important if you want to deal with data analysts or make decisions based on data analytics.
James D. Miller's "Statistics for Data Science" and David Spiegelhalter's "The Art of Statistics: Learning from Data" are two books that will be familiar to anyone who has studied or is studying statistics.
I'm going to use these books as a foundation and combine what I know to give you a quick recap of the theories needed to analyze data from a business perspective.
Of course, it's best to know all the theories of statistics, but in this article, we're going to cover the basic theories of statistics that you need to use data analytics to make decisions.
I'm going to condense a huge amount of concepts into a few posts to make it easier to understand, even if it's a bit difficult and boring, and I'll also cover some basic Python syntax.
I guarantee that if you're new to Python and have no statistical theory, you'll be able to get up to speed quickly.
The Python code will be explained simply with very basic examples.
Understanding the Difference Between Data Analytics and Data Analysis
Data Analytics' goal is to obtain knowledge that is pertinent to an organization's strategy, including business decisions. Includes both organized and unstructured data, and occasionally incorporates big data and machine learning technologies.
Data Analysis is mainly about arranging and condensing data in order to draw further conclusions about the data itself. Is more similar to methods like data mining and data visualization in that it focuses on transforming data into a structured format that can be gathered, cleaned up, and evaluated. It typically works with structured data and frequently employs database and conventional statistical techniques.
What is probability theory?
The mathematical basis of statistical inference and modeling, which aids in making decisions by quantitatively analyzing events or experimentable outcomes, is probability theory.
Regression analysis requires knowledge of correlation and conditional probability, whereas hypothesis testing necessitates knowledge of probability distributions and p-values.
It's crucial to have a basic understanding of terms like correlation, variance, expectation, probability distribution, and standard deviation.
So what is a random variable?
As demonstrated by actions like flipping a coin or rolling a die, it is well known that a random variable's value can vary depending on the test scenario.
We'll look at the fundamental ideas behind random variables in probability theory in this post and see how to use them in Python code.
Random variables are those whose values are based on probability or chance. They are represented by letters and can take on a number of values depending on a probability distribution. It should be evident, for instance, that the numbers 1 through 6 will fluctuate randomly each time you toss a die.
Let's implement this in Python code.
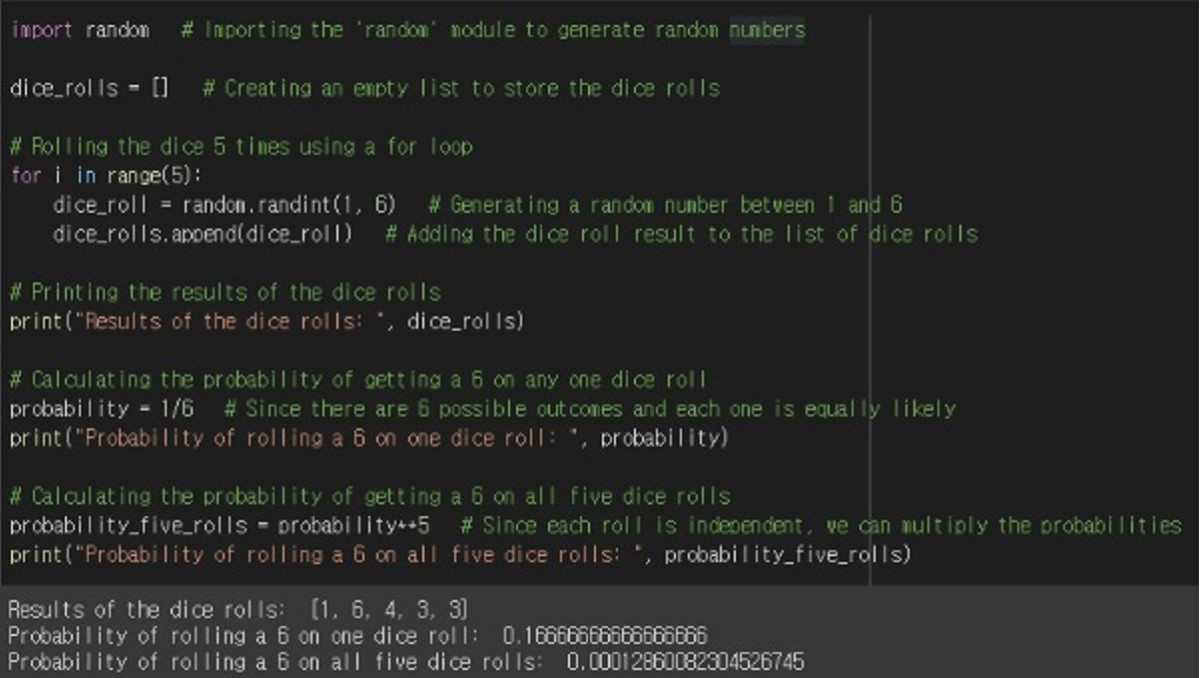
Example: Define a variable (dice) to store the result of rolling a die several times, and implement code to store the value of each die in a list. Also, calculate the probability of rolling a die five times in a row and getting a 6 on all of them.
Commentary on Python code examples
The first line of code imports the 'random' module, which can generate random numbers.
The results of the dice rolls are then saved in an empty List data type called "dice rolls".
The for loop is used five times in this case but not the random. Store the dice result value, 1 through 6, as a random number with the randint() function.
Then use the list.append() function to add these values to the List Data.
What does the list data type in Python mean?
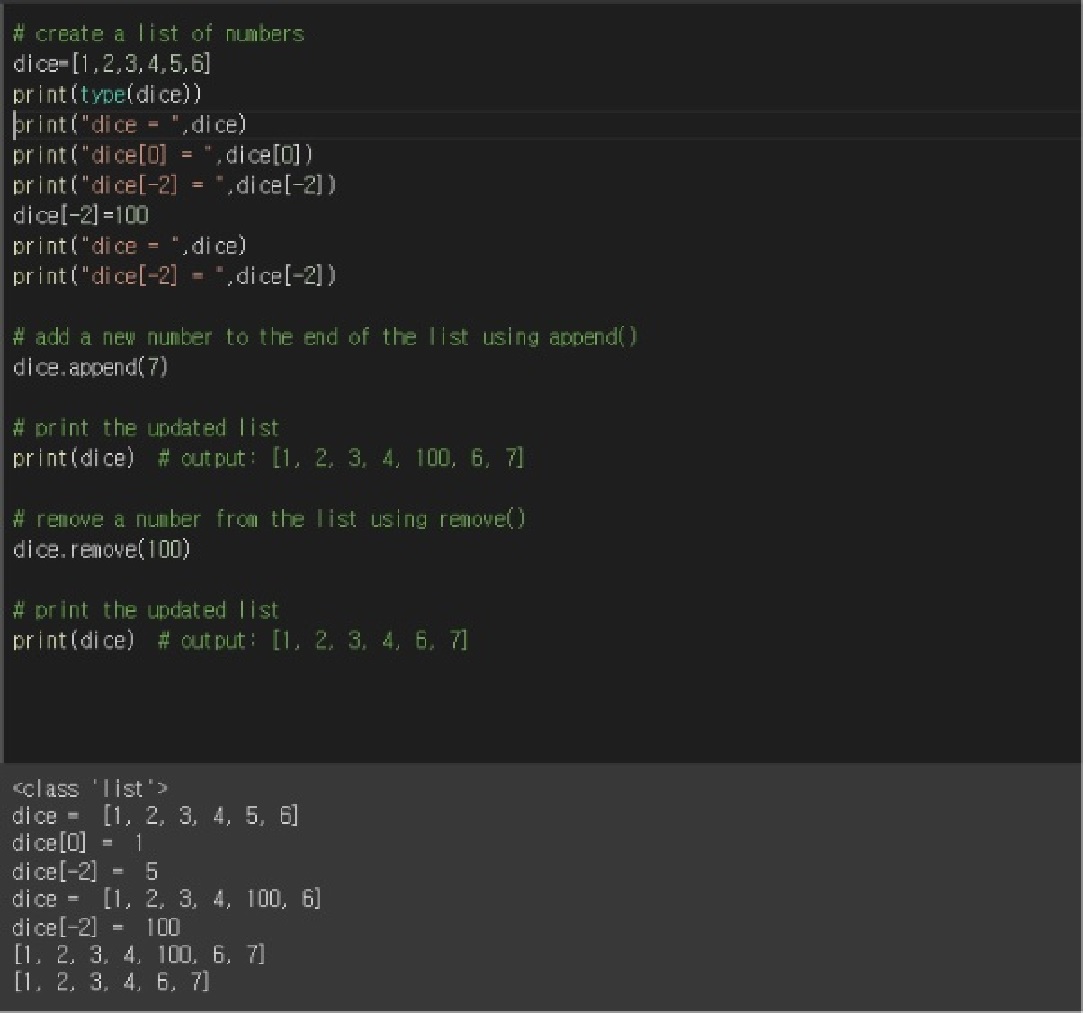
To specify the numbers 1 through 6 that can be rolled with a die, you can define a die in Python as dice = [1, 2, 3, 4, 5, 6].
The information in the list can be changed or modified. For example, the index of the element enclosed in square brackets is the first element and can be used to access or edit the components of the list.
(dice[0] symbolizes the number 1, but this can be changed by stating that dice[0] = "other values").
This index starts at 0 for the first element in the list (in R, it starts at 1), and you can also use a negative index to go to an element at the end of the list.

# Difference between Numpy and List Data Type
| Feature | NumPy | List |
| Memory usage | Uses less memory by storing data in an array form and
implemented in C language | Uses more memory |
| Speed of operations | Supports vectorized operations for faster computation without
using loops | Requires loops for operations and data processing |
| Multidimensional array processing | Specialized for handling multidimensional arrays with fast
operations | Not suitable for processing multidimensional arrays |
| Data type specification | Can specify the data type for faster and more accurate
computation | Cannot specify the data type |
| Usage | Widely used in math-related fields such as science, engineering,
and statistics | Used in various programming fields |
# Advanced example
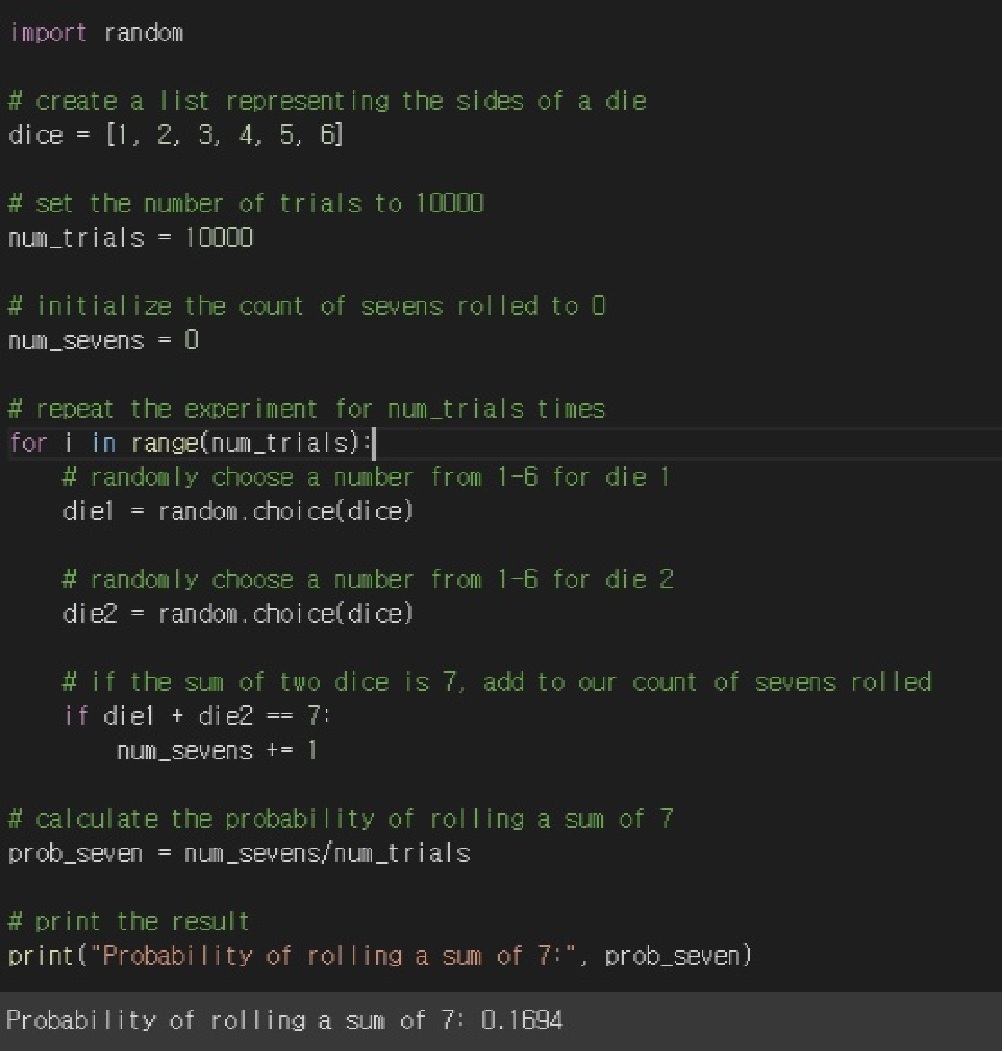
Implement in Python code the probability of a sum of 7 in 10,000 tosses of two dice.
Condition 1: The probability of getting 1-6 is equal.
Condition 2: The roll of one die does not affect the outcome of the other die. (Independent)

Python code Advanced example commentary
This code is an advanced example that calculates the probability of rolling two dice and getting a sum of 7.
After importing the random number module to generate random numbers, we define the dice variable as a list type. We specify the number of times we want to repeat the experiment, 10,000, as the num_trials variable, and the num_sevens variable is initialized to 0 to keep count of the number of times a sum of 7 is rolled.
The for loop repeats the experiment the number of times num_trials. Within the loop, random.choice(dice) is used twice to simulate rolling two dice. If the sum of the two dice is 7, the num_sevens variable is incremented by 1.
At the conclusion of the loop, we divide the number of times a seven has been rolled by the number of trials, and we assign the result to the variable prob_seven. Lastly, we report the result to the console using print().
I sincerely hope you enjoyed it, and I'll be back soon with more interesting material. Thanks for reading.


